
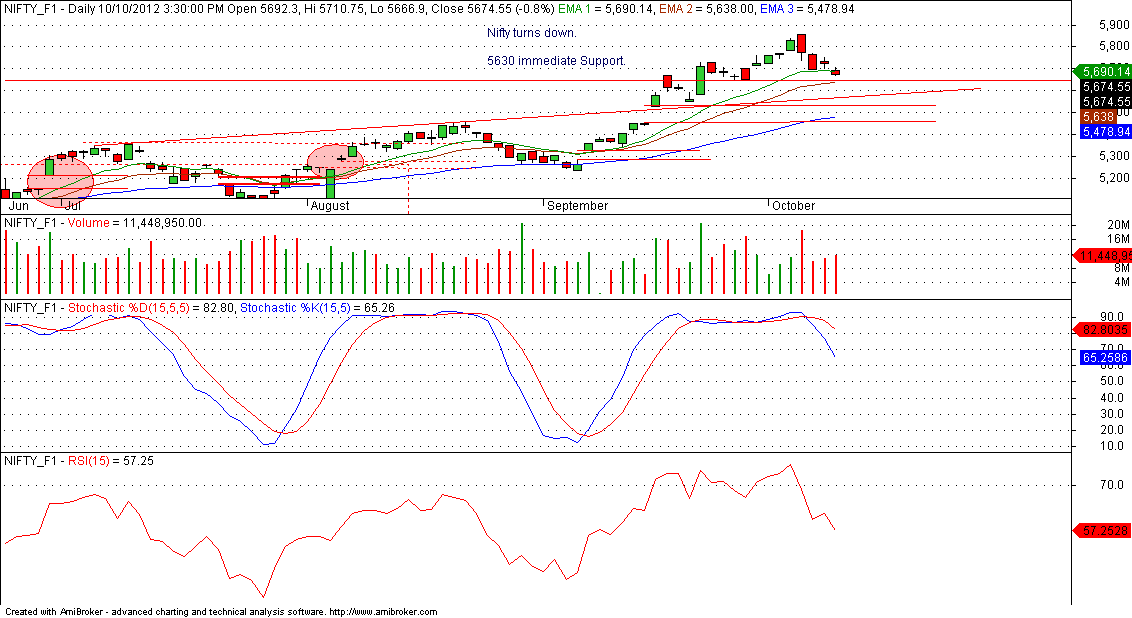
On Monday, Nifty finally broke the 100 point range of 5630 to 5730 Spot, after the RBI Credit Policy, and further dropped 40+ points after that, before closing around 5590 level. Tomorrow, being the monthly closing level, it will be interesting to watch whether the Bulls can make a comeback. On the upside, the levels of 5615/5630 and 5660 are expected to provide stiff resistance to any upmove. On the downside, below 5590, Nifty can further slide towards 5565/5555 levels, below which, lies the Gap support of 5525/5528. Whether Nifty breaks the Gap support and slides further remains to be seen. For traders, Positional Shorts have been triggered below 5630, and they can keep an initial stoploss above 5660 Nifty Spot on closing basis.
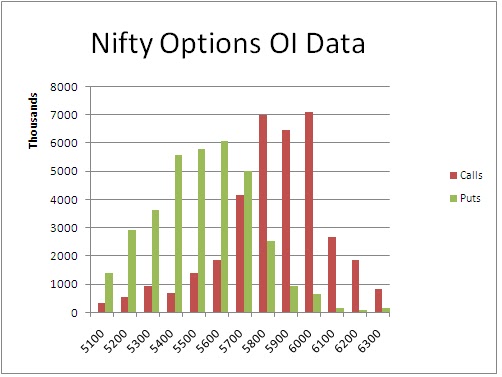
The Nifty Option OI Charts are given below:


On the Options front,it was a day that belonged to the Bears. They added 51 lacs+ OI from 5600 CE to 6000 CE strike. On the other hand, the Bulls were mainly active only at 5500 PE strike, where they added 9 lacs+ OI. Overall, from the Option Charts, the Bears seem to have taken a slight lead at 5700 level, and also dented the support of 5600, but very slightly. 5500 and below are the supports, with max. OI from the Bulls being at 5300 level. On the upside, 5800 and above are the resistances.
For tomorrow, immediate resistance for Nifty Spot comes at 5615 and 5630 level. Any movement till these levels can be good opportunity to create short positions, with Stoploss above 5660 level on closing basis. On the downside, support for Nifty Spot comes at 5590 level, where it took support 4-5 times on Monday. Below this, the Bears will continue to have an upper hand, and they can take Nifty down to test lower level supports of 5565/5555 and 5625. Below 5525, lies the big Gap area.
31 Oct - Nifty Spot resistance at 5615-5630-5660-5695. Support at 5590-5560-5525-5460 - www.niftypower.com
P.S.:
You can see Live Nifty Charts with Buy Sell Signals during market hours Free on our website www.niftycharts.co.in
Also, Read our Daily Nifty Analysis published on our Blog www.nifty-power.blogspot.in and have an Edge in you trading
For our regular Paid SMS Services, see Rates and Services Page on www.niftypower.com


