Friday, January 25, 2013

Break!


We will be taking our Annual Break next week. There will be no trading and no calls given during this period. Normal services will resume from February 4, 2013. All membership will be extended by a week.

We will try to keep the Live Nifty Charts on www.niftycharts.co.in and Nifty View Posts on our Blog www.nifty-power.blogspot.in running during this period. More clarity on this will come next week.

Our phone lines will be down. For urgent communications, members can contact us though email on help@niftypower.com OR power.nifty@yahoo.in

See you all in Week after Next!

Happy Trading!

www.niftypower.com

Friday, January 18, 2013

18 Jan - Nifty View


On Thursday, Nifty opened flat, but rose in intraday trade to close near 6040 levels. On Wednesday Nifty closed below 6020, triggering aggressive positional shorts. These shorts can now keep a Stoploss above today's high near 6055 levels. The breakdown trade as failed on the downside, and the opposite trade can bring swift movement. Hence, it is better to keep a tight stoploss. As long as Nifty trades above 6020 spot, the momentum will lie with the Bulls. If it again falls below that levels, once again aggressive short trades can be taken with same stoploss. But for now, Buy above 6055, Sell below 6020, and trade intraday in between sould be the trading strategy.

The Nifty Option OI Charts are given below:    


On The Nifty Options front, the Bulls added a huge quantity of 20 lacs+ in Nifty Option strikes of 5900 PE to 6000 PE. On the other hand, the Bulls did not do any addition, but covered small positions in 6100 CE and above strikes. Overall the picture remains the same in Nifty Option Charts. There is no 50:50 level, 6000 is a minor support and 6100 is a minor resistance. The major support is at 5900 and major resistance is at 6200, with Open Interest at these strikes crossing 80 lacs+ as of now.

For tomorrow, immediate resistance for Nifty Spot now comes at 6050-6055 levels. This is the level where it has been facing resistance for the past two days. Staying above this, the Bulls will take Nifty towards it next resistance zone of 6075-6095. Above 6095, 6120 and then 6160/6170 levels can come quickly. On the downside, support for Nifty Spot now comes at 6020 levels. If declines below this, the Bears will press hard for lower level of 6005-5980 and 5960/5940. Below 5940, panic selling is expected.

18 Jan - Nifty Spot resistance at 6055-6075-6095-6120. Support at 6020-6005-5980-5960 - www.niftypower.com


P.S.:
You can see Live Nifty Charts with Buy Sell Signals during market hours Free on our website www.niftycharts.co.in

Also, Read our Daily 
Nifty Analysis published on our Blog www.nifty-power.blogspot.in and have an Edge in you trading

For our regular Paid SMS Services, see
Rates and Services Page on www.niftypower.com


Wednesday, January 16, 2013

16 Jan - Nifty View


On Tuesday, Nifty opened flat, and after a few hours of rangebound trading, broke out to make new highs, and close very near to its resistance area of 6050 Spot. If we see last week's movement in Nifty, it declined to close the Gap created on 2nd Jan, and also tested the breakout level of 5945. Thereafter, it closed above 6020 on Monday, and has now closed well above it. Hence, the short term trend remains up. The first signal of this upward momentum waning will be when Nifty gives a close below 6020 Spot. This can now be the stoploss for aggressive trades in Long positions. This is also the level, below which aggressive Shorts can be opened. Although there has not been any significant correction in this upmove, the upward momentum has also been lacking. Also, there is a clear negative divergence on Daily charts. Hence, even in Long positions, it is better not to go all out, and trade carefully. For Short positions, wait for a break and close below 6020. Real downward momentum is expected only when Nifty declines below 5980 and then 5940 levels.

The Nifty Option OI Charts are given below:  


On the Nifty Options front, the Bears added a huge quantity of 13 lacs+ open interest at 6000 PE strike. On the other hand, the Bears primarily covered some of their positions from 5900 CE to 6200 CE strike. Overall, there is no 50:50 level right now, as per the Nifty Option charts. 6000 is a minor support, and 6100 is a minor resistance. The major support is at 5900 and major resistance is at 6200, with Open Interest at these strikes crossing 80 lacs+ as of now.

For Wednesday, immediate resistance for Nifty Spot comes at 6050/6055 levels. Staying above this, the Bulls will remain in control, and will take Nifty higher towards its next resistance zone of 6075/6095. Above 6095, 6120 and then 6160/6170 levels can come quickly. on the downside, support for Nifty Spot now comes at 6020 levels. If declines below this, the Bears will press hard for lower level of 6005-5980 and 5960/5940. Below 5940, panic selling is expected.

16 Jan - Nifty Spot resistance at 6055-6075-6095-6120. Support at 6020-6005-5980-5960 - www.niftypower.com


P.S.:
You can see Live Nifty Charts with Buy Sell Signals during market hours Free on our website www.niftycharts.co.in

Also, Read our Daily 
Nifty Analysis published on our Blog www.nifty-power.blogspot.in and have an Edge in you trading

For our regular Paid SMS Services, see
Rates and Services Page on www.niftypower.com  


Monday, January 7, 2013

8 Jan - Nifty View


On Monday, Nifty opened up, and after trading rangebound for most part of the day, declined to close near the lowest level of the day at 5980 level. 5980 was also the gap support level for Nifty spot, which, it had been able to defend last week. Sustaining below this level will be the first sign of weakness. Aggressive traders can close their Long positions and go short below 5980 on closing basis, with a tight stoploss above 6020 closing on Nifty Spot. Confirmation of this short trade will come only when Nifty spot closes below 5940 Spot level. Hence, conservative traders can skip this aggressive trade and wait for a confirmed signal.

The Nifty Option OI Charts are given below:    


On the Nifty Options front, it was a nothing kind of day, with the Bulls not doing much and the Bears also adding a very small quantity of 11 lacs+ in Nifty Options of 6100 CE to 6300 CE strike. Overall, 600 is the 50:50 level between the Bulls and the Bears. 6200 is the biggest resistance, with open interest at Nifty Options of 6200 CE already crossing 80 lacs. 5900 and below are the supports as of now.

For tomorrow, immediate resistance for Nifty Spot comes at 5995/600 level. As long as Nifty stays below this level, the intraday trend should be considered negative and Short trades should be preferred. Above this zone, Nifty will again head for its higher level resistances of 6020/6050 and 6075. On the downside, support for Nifty Spot now comes at 5980 level. This is the gap support level, and below this level, Nifty will slide to close the gap towards 5960 and 5940 levels. If it closes below 5940, it will considered a failed breakout.

8 Jan - Nifty Spot resistance at 5995-6020-6050-6075. Support at 5980-5960-5945-5930 - www.niftypower.com


P.S.:
You can see Live Nifty Charts with Buy Sell Signals during market hours Free on our website www.niftycharts.co.in

Also, Read our Daily 
Nifty Analysis published on our Blog www.nifty-power.blogspot.in and have an Edge in you trading

For our regular Paid SMS Services, see
Rates and Services Page on www.niftypower.com


Sunday, January 6, 2013

Nifty Charts Consolidated Performace for 2012


We started projecting our Live Nifty Charts on www.niftycharts.co.in in the mid of June 2012, The first month after launch turned out to be a rocket month. Beginners Luck :). Coz in the very next month, Live Nifty Charts gave negative returns. Now, after completing 6 months of this service, here is a look at how our Live Nifty Charts performed in the 6 months since launch:
Live Nifty Charts Consolidated Performace - 2012
MonthMax. Possible Profit/ LotProfit with 1 Lot StrategyProfit with 2 Lot StrategyProfit with 3 Lot Strategy
Jun-125453057101175
Jul-12-11-111-202-333
Aug-1212545126227
Sep-12233153271341
Oct-121111165185
Nov-121120338
Dec-12273160339385
Total138856313122018
Profit in Rupees694002815065600100900
Investment25000250005000075000
%age Profit277.6%112.6%131.2%134.5%
To see this table in a spreadsheet, click here
The Assumptions in the above table are:
1. Investment for 1 lot in Nifty Futures is taken as Rs. 25000. Normally, brokers are offering  margin of only Rs. 11000. However, we recommend keeping some additional cash as Safety Money, hence have taken it as a round figure of 25000.
2. Brokerage and Taxes are not subtracted from the profit. These differ from person to person. We have always emphasized the importance of Low Brokerage. If you want to know the pitfalls of high brokerage, read this article by clicking here.  
Now lets get to the Performance. We generally recommend all members to follow either the Safe Traders Method, or Risky Traders method. In the Past six months, if one would have followed these 2 strategies for trading, the total Net Profit would have been 1312 poits and 2018 Points in Nifty Futures respectively. That's a Profit of more than 130% in just six months! What this means is, had you followed all the signals generated by the Live Nifty Charts over the last six months, you would have more than doubled the money that you put into your trading.
If you see the details of our Performance, you will find that not all months have been profitable. If you try to figure out the accuracy of the Live Nifty Charts, it will not be more than 70%. These are the two most Frequently Asked Questions to us. And our Performace shows just how irrelevant these questions are. You dont need a very high Accuracy to earn from the market. Also, keep in mind that all months will not be profitable. Market does not give a monthly Salary. In Market, when it rains, it pours. But there will be occasional dry months in between. That is the reason why we always recommend having some Safety Money for trading, and Not to Trade with all your capital.
Our Live Nifty Charts are projected every day, for every one to see. All that is required to make such profits is Discipline to follow the Signals beig generated.
Hope to have an even more Profitable 2013.
Happy Trading!
NiftyPower Team
P.S.:
You can see Live Nifty Charts with Buy Sell Signals during market hours Free on our website www.niftycharts.co.in
Also, Read our Daily Nifty Analysis published on our Blog www.nifty-power.blogspot.in and have an Edge in you trading
For our regular Paid SMS Services, see Rates and Services Page on www.niftypower.com

Wednesday, January 2, 2013

3 Jan - Nifty View


On Wednesday, Nifty again opened Gap up, and then traded in a narrow band to close near 5990 level. The trend is up since Nifty broke out from the zone of 5840 to 5940, and it should be considered to be up only, till the time Nifty gives a close below 5920/5930 level again. Positional traders should have opened long positions on Tuesday itself, when Nifty closed above 5940 level. They can now keep their stoploss below 5920 Nifty Spot level. On the upside, Nifty is right at its next resistance point of 5990. Above this, 6020 and 6075/6080 are next major resistances to watch out for.

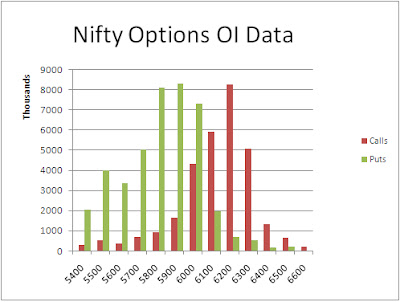
The Nifty Option OI Charts are given below:     


On the Options front, the Bears are busy building a fortress at higher levels. They added a huge quantity of 33 lacs+ open interest in nifty option strikes of 6200 CE to 6400 CE. On the other hand, the only significant open interest addition by the Bulls was that at nifty option strike of 6100 PE, where they added 8 lacs+ open interest. Overall, there is no 50:50 level in the Option Charts as of now. 5900 is a minor support, while 6000 is a minor resistance. 5800 is the biggest support level for the Bulls, while 6200 is the biggest resistance level as of now.

For Thursday, immediate resistance for Nifty Spot comes at 5990/5995 level. Staying above this, the Bulls will be in control, and they will take Nifty higher towards 6020 and 6050/6075 levels. On the downside, support for Nifty Spot comes at the Gap level of 5980 of today. Below this, gap filling can happen, which can take Nifty down towards 5960 and 5945/5930 levels. Till the time Nifty sustains above 5930/5925 level, the short term trend should be considered to be up only.

3 Dec - Nifty Spot resistance at 5995-6020-6050-6075. Support at 5980-5960-5945-5930 - www.niftypower.com


P.S.:
You can see Live Nifty Charts with Buy Sell Signals during market hours Free on our website www.niftycharts.co.in

Also, Read our Daily 
Nifty Analysis published on our Blog www.nifty-power.blogspot.in and have an Edge in you trading

For our regular Paid SMS Services, see
Rates and Services Page on www.niftypower.com