Wednesday, November 28, 2012

29 Nov - Nifty View

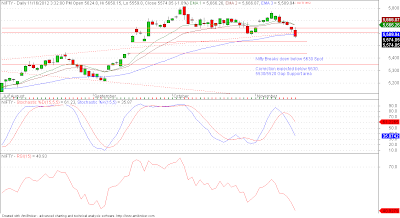
 On Tuesday, Nifty opened up above its resistance of 5655, and then made a smart rally to close near its upper resistance of 5730. As given in earlier Nifty View, Positional Traders are already in Long Positions from near 5615 levels. Some profit should be booked in these longs and Stoploss can now be modified and kept near 5650 Spot level. On the upside, there are minor resistance levels at 5755 and 5785 levels, above which, the recent high near 5815 will be the immediate resistance. On the downside, the levels of 5690 and 5650/5630 will provide support, and short term trend should be considered up as long as Nifty is closing above these levels.

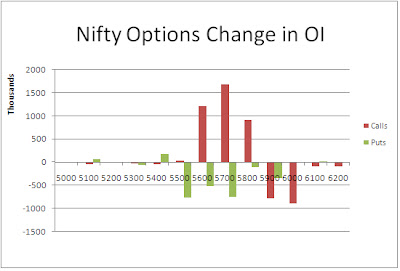
The Nifty Option OI Charts are given below:   


On the Options front, the Bears ran for cover on Tuesday. They covered a huge amount of 58 lacs+ OI at 5600 CE and 5700 CE strikes. This move is understandable, given that Expiry is only 1 day away, as Wednesday was a holiday. But the move from the Bulls was definitely a risky one, who added 31 lacs+ OI at 5700 PE strike. After Tuesday's move, 5700 has become the 50:50 level for Nifty. 5800 remains the major resistance for the series, while 5600 is the major support.

For Thursday, the trend for Nifty should be considered positive as long as Nifty Spot stays above 5690/5695 Spot level. Intraday traders can adopt a Buy on Dips strategy till these levels are protected. On the upside, resistance for Nifty Spot comes at 5730. Staying above this, the Bulls will take it to higher level resistances of 5755 and 5785 levels. On the downside, support for Nifty Spot comes at 5690 level. Below this, it can slide lower towards support levels of 5655/5650 and 5630 levels. The Short term trend should be considered up as long as Nifty Spot stays above 5630 level.

29 Nov - Nifty Spot resistance at 5730-5755-5785-5815. Support at 5705-5690-5655-5630 - www.niftypower.com


P.S.:
You can see Live Nifty Charts with Buy Sell Signals during market hours Free on our website www.niftycharts.co.in

Also, Read our Daily 
Nifty Analysis published on our Blog www.nifty-power.blogspot.in and have an Edge in you trading

For our regular Paid SMS Services, see
Rates and Services Page on www.niftypower.com

Sunday, November 25, 2012

26 Nov - Nifty View

On Friday, Nifty opened flat, declined in intraday trade and tested its support level of 5590 Spot, and then recovered to close near its resistance level of 5625/5630. As given in previous Nifty View, Positional traders should have opened small long Positions with a Stop and Reverse at 5570 Spot level. This Stoploss can be raised near 5590 level now, which was Friday's low. On the upside, 5630/5655 remains the resistances to watch, and until Nifty is able to cross and sustain above this zone, this upmove will be suspect. Hence, it is better to keep a tight Stoploss in Long positions.

The Nifty Option OI Charts are given below:    


On the Options front, the Bulls were seen covering their positions on Friday. They covered 16 lacs+ OI at 5500 PE and 5600 PE strikes. Also, there was no addition by the Bulls at any of the strikes. On the other hand, the Bears also did not do much, except for a small addition of 6 lacs+ OI at 5700 CE strike.Overall, 5600 is a minor support, while 5500 is a major support for this series. On the upside, 5700 and 5800 are the biggest resistances, with Open Interest at strikes of 5700 CE and 5800 CE at 80 lacs+ level.

For Monday, immediate resistance for Nifty Spot comes at 5630 level. Above this, the Bulls will easily take Nifty to its next resistance level at 5650/5655 level. Above 5655, we can see some Short Covering rally till 5685/5705 Nifty Spot level. On the downside, support for Nifty Spot comes at 5590 level. Below this, the Bears will have an upper hand, and they will push Nifty down towards 5570 and 5550 level.

26 Nov - Nifty Spot resistance at 5630-5655-5685-5705. Support at 5605-5590-5570-5550 - www.niftypower.com


P.S.:
You can see Live Nifty Charts with Buy Sell Signals during market hours Free on our website www.niftycharts.co.in

Also, Read our Daily 
Nifty Analysis published on our Blog www.nifty-power.blogspot.in and have an Edge in you trading

For our regular Paid SMS Services, see
Rates and Services Page on www.niftypower.com

Saturday, November 24, 2012

Nifty Performance Update (till 23rd Nov, 2012)


Going into the last week of November, here is a Performance Update of our various packages:
Click here to see the Performance Spreadsheet
NiftyPower’s Performance Summary – November 2012
Max. Profits in Points/LotSafe Traders StrategyRisky Traders Strategy
Nifty Live Charts67177
Rs. 3350Rs. 850Rs. 350
13.4%1.7%0.5%
Nifty Futures SureShot10291125
Rs. 5100Rs. 4550Rs. 6250
20.4%9.1%8.3%
Nifty Future Single Target295887
Rs. 1450Rs. 2900Rs. 4350
5.8%5.8%5.8%
Nifty Options SureShot64102218
Rs. 3200Rs. 5100Rs. 10900
64.0%25.5%27.3%
Nifty Options Single Target31124248
Rs. 1550Rs. 6200Rs. 12400
31.0%31.0%31.0%
Nifty Future Positional98131262
Rs. 4900Rs. 6550Rs. 13100
19.6%13.1%13.1%
November was a month of Contrasts for our Live Nifty Charts and SMS Packages. While the Live Nifty Charts started on a very strong note, we did not match up to the same performance in the first week, and infact, were even negative at one point of time. However, during the last to weeks, we not only covered all losses made in the first week, but also broke into a healthy profit. In fact, in our SMS packages, we have had only 1 loss making call in the last two weeks. On the other hand, our Live Nifty Charts gave some false signals in the last two weeks, which resulted in losing of most of the profits that was generated in the first week. The Silver Lining is that it is still in Green.
The Best package this month has been Nifty Options, which has given a return of nearly 30% till now. The worst performing package is Live Nifty Charts, which is just about breakeven with a 1% return. In the coming days, we will continue to focus on the SMS Packages, and try and maxmize the returns this month. Also, we will have an eye on the Live Nifty Charts, as we definitely do not want any of our package to end the month in Red.
Happy Trading!
NiftyPower Team
P.S.:
You can see Live Nifty Charts with Buy Sell Signals during market hours Free on our website www.niftycharts.co.in
Also, Read our Daily  Nifty Analysis published on our Blog www.nifty-power.blogspot.in and have an Edge in you trading
For our regular Paid SMS Services, see Rates and Services Page on www.niftypower.com

Thursday, November 22, 2012

22 Nov - Nifty View


On Wednesday, Nifty opened flat, and rose steadily thereafter, to close near 5615 level. The short term trend has been down, but the Bulls have been able to defend the Gap Support till now. This was on expected lines, and hence, in previous Nifty View, it was suggested to book some profits in Positional Shorts. Pattern wise, Nifty is forming an expanding triangle, with Lower Lows and Higher Highs. In the move from the recent high, it has formed a Lower Low. Now it remains to be seen whether it forms a Lower High, or a Higher High. If it forms a Lower High, then the short term trend will be considered down, and it will be expected that the Gap will be filled, below 5525. As of now, short term Positional Traders can come out of their Short positions, and open small Long Positions, if Nifty opens and maintains above 5610 Spot level tomorrow. The level of 5570 Spot can be a good Stop and Reverse level for these aggressive Longs. On the upside, Nifty is expected to face immediate resistance in the 5630/5655 zone.

The Nifty Option OI Charts are given below:   


On the options front, it was Bulls' Day Out on Wednesday. They added a huge quantity of 29 lacs+ OI at 5500 PE and 5600 PE strikes. On the other hand, the Bears hardly did any addition. Instead, they covered 4 lacs+ OI at 5600 CE strike. After today's move, there is no clear 50:50 level in Nifty, although 5600 can be considered as that level, with a slight advantage to the Bulls. 5500 to 5700 is the immediate range, and 5800 is the biggest resistance for this series.

For tomorrow, immediate resistance for Nifty Spot comes at 5630/5655 level. Above this, the short term trend in Nifty will be Up and it easily go upto 5685 and 5715 levels. Till the time Nifty stays above 5590/5605 zone, the Bulls are expected to have an upper hand, and traders can use the Buy on Dips strategy. On the downside, support for Nifty Spot comes at 5590 and 5570 levels. Below 5570, the recent low of 5550 will be in danger of being broken, and after that, the Gap support of 5525 will be expected to be broken.

22 Nov - Nifty Spot resistance at 5630-5650-5685-5715. Support at 5605-5590-5570-5550 - www.niftypower.com


P.S.:
You can see Live Nifty Charts with Buy Sell Signals during market hours Free on our website www.niftycharts.co.in

Also, Read our Daily 
Nifty Analysis published on our Blog www.nifty-power.blogspot.in and have an Edge in you trading

For our regular Paid SMS Services, see
Rates and Services Page on www.niftypower.com

Sunday, November 18, 2012

19 Nov - Nifty View


On Friday, Nifty finally broke down below its support level of 5630, and declined further below next support zone of 5580/5585 and closed below it. In previous Nifty View, it was given that the expected movement is down, and Positional traders can keep a Stoploss at 5690/5695 Spot level. That Stoploss can be modified now and kept at 5650/5655 Spot level now. Also, Nifty is now approaching its strong Gap support area of 5525/5535. The Bulls are not expected to give in this support level easily. Hence, Positional traders can book some profit here, and hold on to the remaining shorts with the Stoploss given. If the Bears manage to take and close Nifty below 5520, then a Gap Filling move can be expected. More clarity on this will come after seeing Nifty's movement in the early part of next week.

The Nifty Option OI Charts are given below:  


On the Options front, once again the Bears dominated the scene on Friday. They added a huge quantity of 34 lacs+ OI from 5500 CE to 5700CE strikes. On the other hand, the Bulls were seen covering their positions. They 17 lacs+ OI from 5600 PE to 5800 PE strike. Overall, 5600 has now become the new 50:50 level between the Bulls and the Bears. 5500 and below are the supports. 5700 and above are the resistances. 5800 is the biggest resistance of this series now, with OI well above 90 lacs at 5800 CE strike.

For Monday, immediate resistance for Nifty Spot comes at 5580-5585 level. Staying above this, the Bulls will try to go for a retest of 5605 and 5630/5640 levels. Till it stays below 5630/5640 range, traders should be looking to Sell on Rises at resistance levels. Above 5630/5640, it will again enter into the trading range, and both side trades can be taken. On the downside, support for Nifty Spot comes at 5555/5560 levels. Below this, lies the Gap Support of 5525/5530. The Bulls are likely to try hard to defend this level. Below 5525, a Gap filling till 5435 level can occur, with minor supports in between at  5490 and 5450 levels.

19 Nov - Nifty Spot resistance at 5585-5605-5635-5655. Support at 5555-5525-5490-5450 - www.niftypower.com


P.S.:
You can see Live Nifty Charts with Buy Sell Signals during market hours Free on our website www.niftycharts.co.in

Also, Read our Daily 
Nifty Analysis published on our Blog www.nifty-power.blogspot.in and have an Edge in you trading

For our regular Paid SMS Services, see
Rates and Services Page on www.niftypower.com
 

Friday, November 16, 2012

16 Nov - Nifty View


On Thursday, Nifty opened down on negative global cues, moved further down to test its support level at 5600, before recovering slightly and closed right at the important level of 5630 Spot. The Bears have been trying hard to break below this level, but haven't succeeded till now. It hangs in balance as of now, and tomorrow may be a crucial day to decide further movement in Nifty. The expected move is down, and traders who are holding short positions can move their stoploss above 5690 Nifty Spot level. If the Bulls manage to pull Nifty back from here, then a higher bottom would have formed on short term charts, which will be a good structure for a rally to unfold. Hence, traders who are short can keep a Stop and Reverse at around 5690/5695 Nifty Spot level on closing basis.

The Nifty Option OI Charts are given below:  


On the Options front, it was the Bears day all the way. They added a huge quantity of 38 lacs+ OI from 5600 CE to 5800 CE strikes. On the other hand, the Bulls covered a large amount of 20 lacs+ OI from 5500 PE to 5700 PE strike. After today's move, 5600 still is a good support for Nifty, but the Bears have dented it a little. 5700 is minor resistance level now, while 5800 is the towering resistance for this series.

For tomorrow, immediate resistance for Nifty Spot comes at 5630/5635 level. Staying above this, the Bulls will try and pull Nifty higher towards 5660 and 5680/5690 level. Above 5690, we can see some panic short covering from the Bears. On the downside, support for Nifty Spot comes around 5605 level. Below this, it can slide towards its recent low of 5585/5580, below which, lies the gap support of 5530/5525.

16 Nov - Nifty Spot resistance at 5635-5660-5685-5705. Support at 5605-5585-5560-5525 - www.niftypower.com


P.S.:
You can see Live Nifty Charts with Buy Sell Signals during market hours Free on our website www.niftycharts.co.in

Also, Read our Daily 
Nifty Analysis published on our Blog www.nifty-power.blogspot.in and have an Edge in you trading

For our regular Paid SMS Services, see
Rates and Services Page on www.niftypower.com

Wednesday, November 7, 2012

8 Nov - Nifty View

On Wednesday, Nifty opened flat, but made a big move in intraday, to make a high near 5780 level, before sliding down and closing right at the breakout level of 5755, which has been given as important level in past many Nifty View. Now, if tomorrow Nifty opens and sustains above this level, Positional traders can initiate long positions, with a Stoploss below 5720 Nifty Spot level. If Nifty slides below this level, then it will be again entering into the 100 point range, with slight extensions on both sides, and choppy trading will be expected to continue. Hence, tomorrow can be a very crucial day in deciding the short term trend, and the next tradeable move for Positional traders.

 The Nifty Option OI Charts are given below:    


On the Options front, the Bulls were aggressive today, and added 31 lacs+ OI from 5700 PE to 5900 PE strike. With this move, they converted the level of 5700 from a 50:50 level, to a minor support level. On the other hand, the Bears also added 24 lacs+ OI from 5900 CE to 6100 CE strike. Such big addition  by the Bears on such a positive day shows their confidence of defending higher levels. Overall, 5800 is a minor resistance level, while 6000 and 6100 are the major resistance for Nifty. On the downside, 5600 remains as the biggest support level.

For tomorrow, immediate resistance for Nifty Spot comes at 5750/5755 level. As given above, staying above this, the Bulls will have an advantage, and they can take Nifty higher towards 5785/5790 level. Above 5790, Nifty will be poised to make new highs, which can take it towards its next major resistance at 5880/5890 level, with minor resistances in between at 5820 and 5860 level. On the downside, support for Nifty Spot comes at 5730/5725 level. Beow this, the Bears will push Nifty down towards 5705 and 5690 level. Below 5690, lies the gap that Nifty formed on 2md November, and there will be a high probability of closing this gap, before any further upmove.

8 Nov - Nifty Spot resistance at 5755-5785-5820-5860. Support at 5730-5705-5690-5665 - www.niftypower.com


P.S.:
You can see Live Nifty Charts with Buy Sell Signals during market hours Free on our website www.niftycharts.co.in

Also, Read our Daily 
Nifty Analysis published on our Blog www.nifty-power.blogspot.in and have an Edge in you trading

For our regular Paid SMS Services, see
Rates and Services Page on www.niftypower.com 

Monday, November 5, 2012

5 Nov - Nifty View


On Friday, Nifty opened up near 5690 level, above its crucial resistance levels of 5660, and after making an intraday high near 5711 level, closed near the opening level, making a Doji on Daily Charts. Positional shorts should be closed, as Nifty opened above our level of 5660. However, it is still not time to open Positional Longs, as Nifty has re-entered in the trading zone zone of 5630 to 5730/5750. Normally, a failed breakdown is expected to bring a trending move in the opposite direction. However, a Doji indicates indecisiveness among traders. Hence, it should be confirmed whether to take this move as a false breakdown or a range extension. Any Postional Longs should be attempted by traders only if Nifty Spot manages to breakout above 5750/5755 level. Till then, it is better to trade intraday with small stoploss and targets.

The Nifty Option OI Charts are given below:    


 On the Options front, the Bulls made a good recivery on Friday. They added a huge quantity of 15 lacs+ OI at the two strikes of 5600 PE and 5700 PE. On the other hand, the Bears added 14 lacs+ OI at 5900 CE and 6000 CE strikes, but also covered 8 lacs+ OI at 5700 CE strike. Overall, 5700 has now clearly become the 50:50 level for this series also, just like last series. 5600 has once again emerged as the strongest support level from the Option Charts. Below this, the next support level comes at 5300. On the upside, major resistance level is at 5900 level. 5800 can be only be treated as a minor resistance as of now from the Option Charts.

For tomorrow, immediate resistance for Nifty Spot comes in 5715-5730 zone. If it manages to stay above this zone, then the Bulls will try take to take it higher towards next resistance level of 5750/5755. Above 5755, we can see another short covering rally in Nifty, which can take it to the recent high, and higher. On the downside, support for Nifty Spot comes at 5690/5685 Spot. Below this, lies the Gap that Nifty left on Friday. If Nifty Spot stays below this level, the Bears will have an upper hand, and Nifty can slide towards 5655/5645 and 5625 levels. Hence, it is better to avoid longs if Nifty Spot trades below 5685 on Monday.

5 Nov - Nifty Spot resistance at 5715-5730-5755-5790. Support at 5685-5660-5645-5625 - www.niftypower.com


P.S.:
You can see Live Nifty Charts with Buy Sell Signals during market hours Free on our website www.niftycharts.co.in

Also, Read our Daily 
Nifty Analysis published on our Blog www.nifty-power.blogspot.in and have an Edge in you trading

For our regular Paid SMS Services, see
Rates and Services Page on www.niftypower.com 

Saturday, November 3, 2012

Nifty Performance Update


October month has ended and here is a Performance Snapshot of how our various packages did in this month:
Click here to see the Performance Spreadsheet
NiftyPower’s Performance Summary – October 2012
Max. Profits in Points/LotSafe Traders StrategyRisky Traders Strategy
Nifty Live Charts11165185
Rs. 5550Rs. 3250Rs. 9250
22.2%6.5%12.3%
Nifty Futures SureShot298360592
Rs. 14900Rs. 18000Rs. 29600
59.6%36.0%39.5%
Nifty Future Single Target167334501
Rs. 8350Rs. 16700Rs. 25050
33.4%33.4%33.4%
Nifty Options SureShot123290640
Rs. 6150Rs. 14500Rs. 32000
123.0%72.5%80.0%
Nifty Options Single Target66264528
Rs. 3300Rs. 13200Rs. 26400
66.0%66.0%66.0%
Nifty Future Positional7272144
Rs. 3600Rs. 3600Rs. 7200
14.4%7.2%7.2%
Notes:
October was a very good month for our SMS Subscribers. Our accuracy was spot on. While the index was largely rangebound within a 100 point range for the entire month, we were able to extract some very good trades in the choppy market.
Nifty Options SureShot was our best package of the month, with returns for risky traders as high as 80%! That is almost doubling of the capital in a space of just 1 month! Hope to continue with similar performance in future too.
The least performing package of the month was Nifty Futures Positional. This was our best package for the past three months. Since October was a very rangebound month, we got very few opportunities to trade Positionally. However, we gave 2 calls in this package, and both of them were profitable. Hence, accuracy wise, it was good. This package returned 7.2 % for the month.
In Live Nifty Charts, the performance was not as good as last month, which is understandable, as the market was very rangebound. The good thing to note is that the Charts ended the month in the Green, giving a decent enough return of 12.3 % for Risky traders. Also, Novemeber has started with a bang, and we expect much better performance from the Live Nifty Charts in the festive month.
Going into the Festive Season, we have also Reduced the Cost of Single Target Packages, making it Equal to the SureShot Packages. Nifty Live Charts will also continue to be Free for the time being. Request all Users to Support Us and in this initiative of keeping the Live Charts Free!
Happy Trading!
NiftyPower Team
P.S.:
You can see Live Nifty Charts with Buy Sell Signals during market hours Free on our website www.niftycharts.co.in
Also, Read our Daily  Nifty Analysis published on our Blogwww.nifty-power.blogspot.in and have an Edge in you trading
For our regular Paid SMS Services, see Rates and Services Page on www.niftypower.com

Friday, November 2, 2012

2 Nov - Nifty View


Nifty, after giving the breaking below 5630 Spot level on Tuesday, crawled back up in the past two days, to close near 5640 level on Thursday. The Short term trend remains down till it is trading and closing below 5660 Spot level. Hence, Positional traders can maintain their stoploss at 5660 level. Friday's movement will provide better clues to the coming movement in Nifty. If it manages to close above 5630/5660 level, it will once again enter into the sideways range. The range of 5630 to 5730/5750 is better suited for intraday trades, rather than taking Positions on either side, as movement has been choppy within this range. But volatility is sufficient for good intraday trades.

The Nifty Option OI Charts are given below:    


On the Options front, the Bears went missing today. There was hardly any addition done in Call Options. On the other hand, the Bulls also added only a small amount of 4 lacs+ OI at 5600 PE, and another 7 lacs+ OI at 5300 PE strike. It looks as if the Option writers are also keeping a wait and watch policy, after today's movement. Overall, from the Option Charts, 5600 is a minor support, while 5700 is a minor resistance area. Once this range resolves, we should get clear support and resistance levels from the Option Charts.

For tomorrow, immediate resistance for Nifty Spot comes around 5660/5670 level. If sustains above this level, then it should head for higher levels of 5695 and 5730/5750 level. Above 5750, it will be an upward breakout in Nifty. On the downside, support for Nifty Spot comes around 5630 level. If breaks it again, then the Bears will again try to push it lower towards 5605/5590 and 5560 level.

2 Nov - Nifty Spot resistance at 5665-5695-5730-5755. Support at 5630-5605-5590-5560 - www.niftypower.com


P.S.:
You can see Live Nifty Charts with Buy Sell Signals during market hours Free on our website www.niftycharts.co.in

Also, Read our Daily 
Nifty Analysis published on our Blog www.nifty-power.blogspot.in and have an Edge in you trading

For our regular Paid SMS Services, see
Rates and Services Page on www.niftypower.com