Sunday, July 29, 2012

30 July - Nifty View


On Friday, Nifty opened gap up on positive global cues, but could not sustain higher levels and closed just above 5100 level. It got resisted exactly at the Gap resistance of 5150/5170 on Friday, and crossing this zone will be crucial for any further upsides. Once above this, Nifty can easily climb towards 5230/5270 levels. Above 5270, another Gap resistance exists, which Nifty has been unable to close in previous attempts. Hence, positional traders can attempt aggressive longs above 5150/5170 zone in Nifty, with Stop and reverse below Friday's low.

The Nifty Option OI Charts are given below:


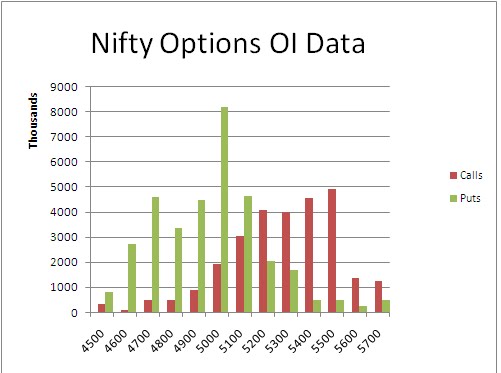
There has been a a lot of activity on the Options front in the July series till now. The Bulls were active till 5100 PE strike, where they added nearly 40 lacs OI, the maximum being at 5000 PE and 5100 PE. On the other hand, the Bears were mainly active at higher strikes of 5400 CE and 5500 CE strike, where they added 23 lacs+ OI. Overall, 5000 stands tall as the major support for this series. It would make sense to treat this level as a pivot and be Bullish above this level and Bearish below it. No real resistance has sill formed as per the Option charts. 5100 and 5200 level seems to be the battleground level as of now.

For Monday, immediate resistance for Nifty Spot comes at 5125/5130 level, above which, it will again go and retest its resistance zone of 5150/5170. Above 5170, Nifty will head for higher level resistances of 5230 and 5265. On the downside, support for Nifty Spot comes at 5075/5080 level. Below this, the Bears will have an upper hand and take Nifty down towards lower levels of 5050/5020.

30 July - Nifty Spot resistance at 5130-5160-5205-5230. Support at 5075-5050-5020-4990 - www.niftypower.com

Visit here for Nifty Tips - Nifty Future Tips and Nifty Option Tips

Thursday, July 26, 2012

27 July - Nifty View


On Thursday, Nifty finished its July series closing down at around 5050 level. It was a rangebound series, where we have seen a little bit of volatility only in the later part of the series. It was not a series for day traders, but positional traders, who are short from 5250 level, are good in profits right now. Nifty has closed below is 200 DMA on Thursday, and now that will be its first major resistance in case of any upmove. Above that, 5170/5200 is going to be the next major resistance.

The Nifty Option OI Charts are given below:


At the start of the series, the Options writers were active, adding a good amount of open interest across various strikes. The Bulls were most active at 5100 CE and 5200 CE strikes, where they added 24 lacs+ OI.The Bears added 21 lacs+ OI at 4900 PE and 5000 PE strikes. Interesting to note is the huge amount of open interest of 70 lacs+ at 5000 PE strikes. The Bulls seem to be counting on Nifty holding this level. This also means that any bigger fall is ruled out till Nifty is trading above this level. Hence, those in Positional shorts should book profits before this level and reshort if this level breaks. A close below 5000 can cause some panic among the writers of 5000 PE. Till then, don't consider this fall as a bigger downtrend.

For tomorrow, immediate resistance for Nifty Spot comes at 5070/5080 zone. Above this, Nifty Spot can again attempt a close above 5100 level, facing resistance at 5120/5130 levels. On the downside, support for Nifty Spot comes at 5020 levels. Below this, it can slide towards 4990-4960/4950 and 4905 levels, with some panic selling.

27 July - Nifty Spot resistance 5075-5105-5125-5150. Support at 5020-4990-4960-4905 - www.niftypower.com

Visit here for Nifty Tips - Nifty Future Tips and Nifty Option Tips


Sunday, July 22, 2012

Higher Highs and Higher Lows – AFL

The concept of Higher Highs and Higher Lows is derived from Dow’s theory, which states that the trends change when the pattern of peaks and troughs is reversed. It is a very simple theory, and one that can be used to identify the larger trend of the market.

Bull Trend – When the Highest point of a rally exceed that of the previous one, and


the Lowest point during correction of such a rally is higher the lowest point of the previous rally, the trend is considered Bullish.

Bear Trend - When the Lowest point of a rally exceed that of the previous one, and the Highest point during a correction of such a rally is lower than the highest point of the previous rally, the trend is considered Bullish.

Instead of such simple patterns, we can also have Highers Highs

and Lower Lows OR Lower Highs and Higher Lows, which develop other trading patterns like Wedge, Triangles etc.

You can download a simple AFL for identifyinhg Higher Highs and Higher Lows from the below link:

Download Higher Highs and Higher Lows AFL


Thursday, July 19, 2012

19 July - Nifty View


On Wednesday, Nifty took support near it Gap low area of 5160, and entered back into the region above 5200. The Bears could not manage a good close below 5190, which was given as the support level for Nifty. Now, since it has taken support and rising, we have to see how the Bulls behave in the 5250-5270 region. Failure to cross this zone will again put Nifty into rangebound mode, which has been generally the trend for the month of July. However, a move above this zone can lead to a rally, and probably a retest of 5320-5330 zone.

The Nifty Option OI Charts are given below:


There was no real activity on the Options front on Wednesday, except for covering of 5 lacs+ OI by the Bears. Overall, 5200 still is the battleground level between the Bulls and the Bears. 5300 and 5400 are towering resistances, and the Bulls will have to do make a real effort to cross these before this expiry. The amount of covering that we see at these strikes, if and when Nifty trades near 5300 level, will give further clues to its movement.

For tomorrow, immediate resistance for Nifty Spot comes around 5245 level. Staying above this, it will head for higher level resistances of 5270/5305 and 5325. On the downside, support for Nifty Spot comes at 5225/5220 level. Blow this, the Bears will try to push it down towards 5190 and 5160 level again. Traders can adopt a strategy of Long above 5270 and Short below 5240 for Thursday.

19 July - Nifty Spot resistance at 5245-5270-5305-5325. Support at 5220-5190-5160-5135 - www.niftypower.com

Visit here for Nifty Tips - Nifty Future Tips and Nifty Option Tips


Tuesday, July 17, 2012

17 July - Nifty View


On Monday, Nifty declined but took support near its gap area created on 29th June. The low on that day on Nifty Spot was 5189, whereas the low yesterday was 5190. If Nifty breaks and closes below this level, then most likely it will go down to close the Gap. The Support zone will then be 5135-5160. Hence, for now, no trades are open. Positional shorts can be opened below 5190, which has to be confirmed by a close below 5135.

The Nifty Option OI Charts are given below:


On the Options front, the Bears were active at 5200 CE and 5300 CE strikes, where they added 15 lacs+ OI. On the other hand, the Bulls covered 15 lacs+ OI from 5200 PE to 5400 PE strikes. Overall, from the Option charts, 5200 seems to be in danger as of now. Below this level, 5000 is the next major support level for the Bulls. 5300 and 5400 has emerged as the major resistances for this series.

For Tuesday, immediate resistance for Nifty Spot comes at 5215-5245 zone. Staying below this zone, the trend will be Bearish and the support level of 5190 will be in danger. In the zone, the movement is expected to be choppy. Above 5245, Nifty Spot can head for 5270, where again it will face selling pressure. Only if it manages to close above 5270, can the Bulls for some relief rally. On the downside, support for Nifty Spot comes at 5190 Spot. Below this, it will further slide towards 5160-5135 and 5120 levels.

17 July - Nifty Spot resistance at 5215-5245-5270-5305. Support at 5190-5160-5135-5120 - www.niftypower.com

Visit here for Nifty Tips - Nifty Future Tips and Nifty Option Tips


Donchian Channels – AFL


The Donchian channel is an indicator used in market trading developed by Richard Donchian. It is formed by taking the highest high and the lowest low of the last n periods. The area between the high and the low is the channel for the period chosen.

It is commonly available on most trading platforms. On a charting program, a line is marked for the high and low values visually demonstrating the channel on the markets price (or other) values.

The Donchian channel is a useful indicator for seeing the volatility of a market price. If a price is stable the Donchian channel will be relatively narrow. If the price fluctuates a lot the Donchian channel will be wider. Its primary use, however, is for providing signals for long and short positions. If a security trades above its highest n periods high, then a long is established. If it trades below its lowest n periods low, then a short is established.

Originally the n periods were based upon daily values. With today’s trading platforms, the period may be of the value desired by the investor. i.e.: day, hour, minute, ticks, etc.

Source – Wikipedia

Download Donchian Channel AFL Code with Buy/Sell Signal

Friday, July 13, 2012

13 July - Nifty View

Nifty closed below 5250, closing out the Positional longs. Short term trend has turned down now, and will be considered up only if Nifty Spot gives a closing above 5330. However, consider the medium term trend as up until we get a monthly closing below 5200. Wait for a confirmation of closing below 5200, before initiating a short trade.

13 July - Nifty Spot resistance at 5255-5285-5305-5335. Support at 5220-5190-5160-5125 - www.niftypower.com

Visit here for Nifty Tips - Nifty Future Tips and Nifty Option Tips

Wednesday, July 11, 2012

11 July - Nifty View


Nifty has largely consolidated in a tight range in the month of July. What is positive for the Bulls is that it has held on to the supports formed on the way up, which has helped in safely trailing the long trade positionally. Positional traders can now update their stoploss to 5250. The medium term trend should be considered up till Nifty does not give a monthly closing below 5200 level.


The Nifty Option OI Charts are given below:

On the Options front, it was a day for the Bulls, as they added a huge quantity of 42 lacs+ OI between 5000 PE to 5500 PE strikes. On the other hand, the Bears decided to stay back, and added a small quantity of OI at 5500 CE and 5600 CE strikes. Overall, the Option Charts indicate major support at 5200 and 5000 level for Nifty, and resistance at 5400 level. 5300 is 50:50 level between the Bulls and the Bears.

For tomorrow, consider the intraday trend as up as long as Nifty Spot trades and sustains above 5320-5330 zone. Below this zone, it is better to avoid intraday trades and let the trend become clear. Above 5330, Nifty Spot will head for 5400+ level, with minor resistances coming at 5360 and 5385 levels. On the downside, support for Nifty Spot comes at 5320 and 5290 level. Aggressive short trades can be tried below 5290/5285, for downside targets of 5260 and 5220.

11 July - Nifty Spot resistance at 5360-6385-5405-5445. Support at 5320-5290-5260-5220 - www.niftypower.com

Visit here for Nifty Tips - Nifty Future Tips and Nifty Option Tips


Monday, July 9, 2012

Low Brokerage - Compositedge

Good News!

Now we have tied up with Compositedge, a low brokerage based in Bangalore, which offers Rs. 25 per trade brokerage. It is a 16 year old brokerage firm, promoted by by very respected people. To know more about Compositedge, click here.

Low Brokerage is a MUST for intraday trading. For positional trading and investments, traditional brokerages work well. But for intraday trading, specifically in Futures & Options, having a high brokerage can end your career in trading. For some maths on How High Brokerage can Kill You, click here.

The Icing on the cake is, Compositedge is offering Free 25 trades to new clients for the first 15 days. To Top that, if you get referred by NiftyPower, you can get a Rs. 500/- discount on any of our packages! Its a win-win situation for everybody.

If you would like to get referred to Compositedge through us, send us your Name, Phone No. and Email, and we will do the needful. Otherwise, you can contact them directly also, through their website.

Happy Trading!

Sunday, July 8, 2012

Nifty Live Charts – Premium

Thanks to All who showed great support during the past 3 weeks for Nifty Live Charts. Nifty Live Charts will go Premium from Monday, 9th July, 2012.

In its Test phase, Nifty Live Charts was run from 15th June to 6th July, during which time it gave an ideal profit of more than 500 points in Nifty Future.

The Service Details for Nifty Future Live Charts is given below -

  • Nifty Live Charts is going to be included Free of Cost with all our existing SMS packages
  • For clients who don’t require the SMS package, a separate package consisting of only Nifty Live Charts is introduced
  • The Charges for Nifty Live Charts will be Rs. 1000/month. This will be reviewd every 3 months and raised/ lowered based on the subscriptions (more the subscriptions, lesser will be the charges)
  • As with all our other packages, Nifty Live Charts will carry a Performance Guarantee of 300 points

During the testing phase, lot of questions were asked about the system, how to trade, its accuracy etc. We have tried to club the general questions and answered them in the FAQ section. Please go through them for better clarity on NiftyPower’s Intraday Nifty Trading System.

If you want to subscribe to any of our packages, kindly contact us through the website/ through www.niftypower.com/ email on power.nifty@yahoo.in OR help@niftypower.com/ Phone on +91-8105600113.

Happy Trading!

NiftyPower Team

Thursday, July 5, 2012

6 July - Nifty View


On Thursday, Nifty has closed just above its resistance zone of 5315-5320. Is has been a lackluster week, with extremely rangebound movement. Tomorrow, being the end of the week, some movement might be seen. The trend remains up as long as Nifty remains above 5200 now, and positional traders can raise their stoploss to this level. Before that, 5260 and 5220 are two minor support areas to watch out for, which can be re-entry level for longs, if nifty dips to those levels.

The Nifty Option OI Charts are given below:

The Bulls were again quite active the strikes of 5200 PE and 5300 PE , adding 14 lacs+ OI. On the other hand, the Bears are adding OI at higher strikes. They added 10 lacs+ at 5500 CE and 5600 CE. Overall, from the Option charts, 5200 and 5000 are the supports, while 5400 is the resistance.

For tomorrow, immediate resistance for Nifty Spot comes at 5320/5330 zone. Staying above this, Nifty will target 5400+ levels, with minor resistances coming at 5360 and 5385 levels. On the downside, support for Nifty Spot comes at 5300/5290 levels. Below this, it will slide towards 5260-5220 and 5190/5200 levels. Below 5200/5190, Positional longs can be reversed to Shorts.

6 July - Nifty Spot resistance at 5330-5360-5385-5405. Support at 5295-5260-5220-5195 - www.niftypower.com

Visit here for Nifty Tips - Nifty Future Tips and Nifty Option Tips

5 July - Nifty View


Nifty made a Doji today. It has been trendless for the past 3 trading days. Breakout from the narrow range of 5270 to 5330 can give some movement. Levels remain the same as given on previous post.

5 July - Nifty Spot resistance at 5315-5350-5385-5405. Support at 5290-5265-5245-5220- www.niftypower.com

Visit here for Nifty Tips - Nifty Future Tips and Nifty Option Tips

Monday, July 2, 2012

3 July - Nifty View

Nifty closed almost flat after opening up on low volumes. Same levels as yesterday remains valid. Trend remains up.

Visit here for Nifty Tips - Nifty Future Tips and Nifty Option Tips

2 July - Nifty View


On Friday, Nifty finally broke out above its resistance zone of 5180-5190, after almost a month of consolidation. Positional traders, who patiently held on to longs with stoploss of 5080 will be a happy lot now. The stoploss can now be raised to around 5150 Nifty Spot level. The uptrend is now confirmed and it remains to be seen how far it can go. No Shorts till Nifty maintains above 5150 on closing basis. Stay with the trend, and the market will reward sooner or later.

The Nifty Option OI Charts are given below:


It was the first day of the new series, and lot of activity was seen on the Options front. The Bulls added a huge quantity of 33 lacs+ OI at 5200 PE and 5300 PE strikes. The Bears were also active, but at higher strikes. They added an equally huge 27 lacs+ OI at 5400 CE and 5500 CE strikes. Overall, at the start of the series, 5000 seems to be the base as of now. A major resistance area has not been formed as yet. 5200/5300 can be treated as the 50:50 level as of now.

For tomorrow, immediate major resistance zone for Nifty Spot comes at 5340-5350 zone, with minor resistance at 5290 and 5315 level. The trend will be positive and Buy on Dips strategy should be adopted as long as Nifty Spot is above 5265 level now. On the downside, support for Nifty Spot comes at 5265 level. Below this, it can slide to test support levels at 5245 and 5220, which can be a good opportunity to re-enter/add to positional longs.

2 July - Nifty Spot resistance at 5290-5315-5350-5385. Support at 5265-5245-5220-5190 - www.niftypower.com

Visit here for Nifty Tips - Nifty Future Tips and Nifty Option Tips